DCO Margin Methodology
Initial margin for Bitcoin and Ether perpetual futures: calibration, backtesting and the no-offset rule, as documented for the Form DCO filing under 17 CFR 39.13(g). Each product is margined outright; the clearinghouse lists no options and applies no spread credits.
Crypto margin calibration and backtesting
The published CME rates are another clearinghouse's model output. A clearing organization filing under 17 CFR 39.13(g) has to show the confidence level, margin period of risk, lookback and stressed observations behind its own number, and prove coverage with backtests. The Crypto Margin Calibration panel on the Futures Margin page implements that for BTC and ETH, and its Excel report is laid out as filing evidence.
Model
- Returns and volatility. Daily log returns from daily closes supplied by the price provider in use (Yahoo Finance by default, with Coinbase Exchange, Bitstamp, FRED and Alpaca as fallbacks and the CME CF reference rates once licensed), every series cut to a fixed history window that starts January 1, 2018, the first date from which more than one provider has daily closes for both products. An exponentially weighted variance with decay 0.97 gives the volatility forecast for each day from returns through the prior day. For the current scan the volatility used is the larger of the EWMA forecast and VolS, the implied vol of the 90 percent strike put at the listed expiry nearest 90 days on Deribit, so the forecast rises within minutes in a shock rather than at the next close; the backtest uses EWMA alone until a VolS history exists.
- Standardized residuals. Each realized return over the margin period of risk (1 to 3 days, overlapping) is divided by the forecast volatility for that period, giving a residual that carries the shape of the return distribution without its volatility level.
- Sample. Residuals from the lookback window (default two years) plus residuals from fixed stressed windows that never leave the sample: March 2020, May 2021, May to June 2022, November 2022, August 2024, and October 2025.
- Scenarios and expected shortfall. Each residual is rescaled by the current volatility forecast to form a scenario return. The expected shortfall at the confidence level (default 99 percent) is computed on each tail separately, converted to a simple-return loss; the model scan is the larger tail.
- Buffer and floor. The model scan is increased by an anti-procyclicality buffer (default 25 percent) and floored at the unconditional expected shortfall of the full history window (from January 1, 2018), so margin does not decay in calm periods. The scan range is the larger of the buffered model value and the floor, and the panel reports which one binds.
- Contract margin. Scan range times price times point value: 5 for BTC, 0.1 for MBT, 50 for ETH, 0.1 for MET.
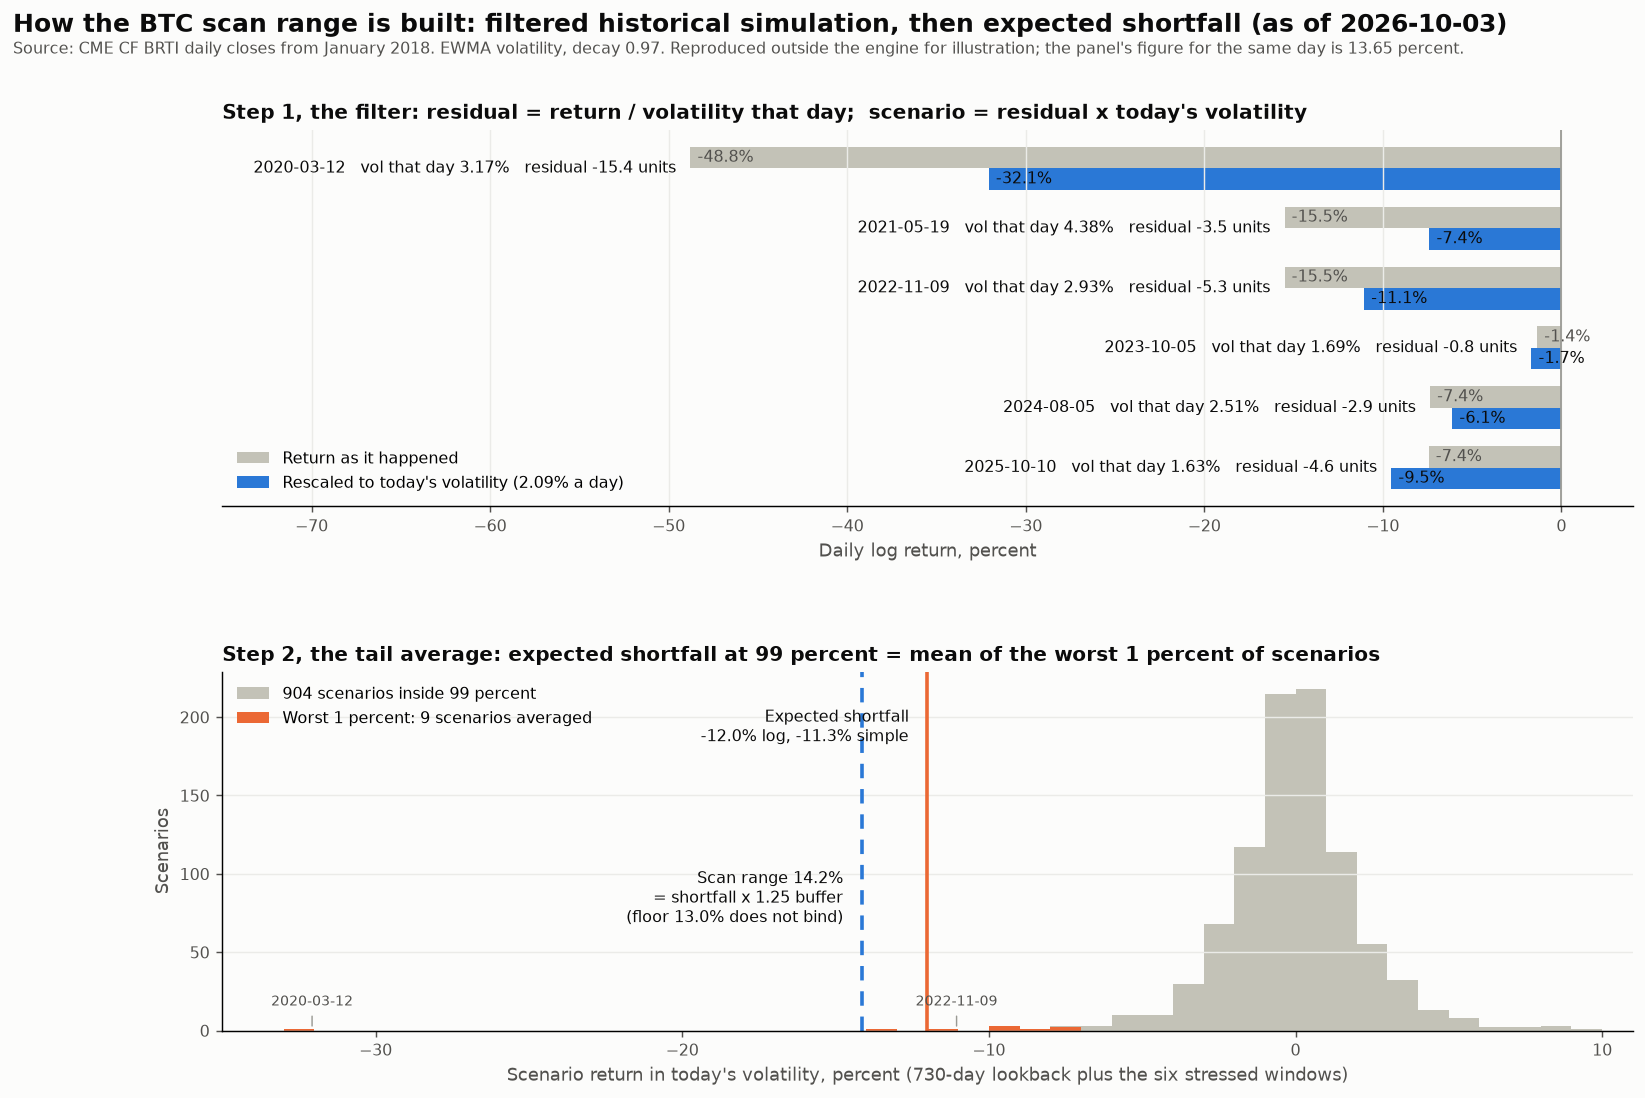
Worked illustration on the BTC index history (October 3, 2026). Step 1 divides each day's return by the volatility that prevailed on that day and multiplies by today's; March 12, 2020 (down 49 percent in log terms at 3.2 percent daily volatility) becomes a 32 percent scenario at today's 2.1 percent, while October 10, 2025 (down 7.4 percent at 1.6 percent volatility) becomes 9.5 percent. Step 2 averages the worst one percent of the 913 scenarios, nine of them, to get the expected shortfall of 11.3 percent, times the 1.25 buffer gives the scan; the floor from the full history is checked beside it.
Backtest
For each day in the window (default two years) the scan range is recomputed using only data before that day, then compared with the realized move over the margin period. A long breach is a fall larger than the scan range; a short breach is a rise larger than it. The panel reports breaches per tail against the expected count, the Kupiec proportion-of-failures p-value, a Basel-style traffic light on the binomial count, the largest loss as a multiple of the scan range, the range of scan values over the window, the worst rolling 250-observation breach count per tail, and the Christoffersen independence p-value (do breaches cluster?) with the conditional-coverage p-value that combines it with Kupiec. Zero breaches with a Kupiec p-value under 0.05 indicates over-coverage rather than a failure.
Offsets
The clearinghouse applies no spread or portfolio margin offsets. Each product is margined outright at its own scan range; a position long BTC and short ETH posts the sum of the two outright margins, and micro contracts are margined pro rata to the standard contract. On top of the outright margin, the stress engine charges a size ladder per origin and product: the scan scaled by the square root of the liquidation time (notional over the liquidatable notional per day, floored at the margin period) plus a bid-ask cost, with depth parameters that are placeholders until measured. This is the D.7 statement in the filing outline.
Parameters
Confidence, margin period of risk, lookback and buffer are selectable on the panel and recorded on the Parameters sheet of the Excel report together with the stressed windows and the history used, so a filed number can be reproduced.
Stress test and cover-one
The weekly stress test replays the worst realized moves in named windows and four hypothetical shocks (including an intraday replay of October 10, 2025) against every clearing member's book, sizes cover-one and cover-two, and carries case studies of the stress events. The method, the data sources and a worked example are in the workroom documentation (project members).
Related
- DCO Risk Workroom: readiness tracker, weekly stress test, case studies, price provider comparison.
- Crypto Basis: perpetual funding versus the CME dated basis and spot.
- CME Futures Margin Methodology: the general calculator for CME financial and crypto futures, a separate tool with its own conventions.